R fractals
Just for the fun of it, and to see if it could be done, I started playing with fractals in R. I was really surpised to see R's suitability for handling these mathematical objects. In fact, the easiness of integrating C code with R and R's graphics capabilities makes R superbly fitted for this purpose (perhaps even more than some 'professional' fractal generators).
This page contains some beautiful images created with R and the code
needed to generate them. Some functions are linked to C code, but don't
get scared! R's documentation contains plenty of material on how to
compile and use shared objects.
The logistic equation
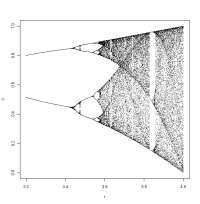
There is a special case of the logistic equation of population growth that shows some surprisingly complex behavior. This deceptively simple function is
Xi+1 = r * Xi * (1 - Xi)
where Xi is the relative population size at time i, Xi+1 is the
size at the next generation and r
is the growth rate. In this model X varies between 0 and 1. The interesting point here is that for r values below ~3.5 the population
will reach a stationary size after many generations or will oscillate
between a set of fixed values; however, when r is higher than ~3.5 the system
becomes chaotic and the population size will oscillate in a seemingly
random manner. The picture above
shows what happens to X after 50 or more generations under different r values. The code to generate that
graph is here: logistic.R.
The Mandelbrot set
Perhaps the most famous fractal set. It arises from a very simple mathematical relationship
Zi+1 = Zi * Zi + C
where Z and C are complex
numbers (e.g. a + bi ). The
initial value of Z, Z0 is equal to 0, and the value of C
is chosen arbitrarily. Then succesive iterations of the above equation
are calculated, and the evolution of Z is assesed. It can be
mathematically proved that if after certain number of iterations the
modulus of Z is greater than 2, then the value of Z will head off to
infinity. The Mandelbrot set is then defined as the set of points C in
the complex plane for which the iteration procedure is bound (i.e.
doesn't head off to infinity!). Bellow is a small galery of pictures
depicting different regions of the Mandelbrot set; points belonging to
the set are shown in black, and the rest are coloured according to the
number of iterations needed for |Z| > 2.


The files needed to generate images like the ones above are here: mandelbrot.zip
Any question or comments please e-mail me at_mariodosreis@yahoo.com
I am willing to accept any kind of fractal stuff done with R!
Update December 2016: The Mandelbrot set is now in my R fractal package: github.com/mariodosreis/fractal
